Why I/O Wait Matters on Linux
High I/O wait on Linux is when CPUs are idle waiting for storage operations to complete, that is reflected by elevated iowait values. For system administrators and engineers, iowait linux troubleshooting is critical because high latency degrades application throughput, increases response times, and can mask other problems in the stack.
This article focuses on pragmatic diagnostics and fixes, showing how to measure latency with tools such as iostat, atop, blktrace, perf and fio, how to interpret results, and how to apply targeted remediations at the process, filesystem, and kernel levels.
Quick checklist to confirm high I/O wait
Begin with a short checklist to confirm the issue before deep diving. This helps avoid chasing transient spikes and ensures you gather data for reproducible analysis.
Run these checks quickly on the affected host, and record timestamps and outputs for correlation with application logs.
- Run top or htop, observe the %wa field and blocked processes.
- Use iostat -x 1 10 to capture per-device utilization and await times.
- Check dmesg and system logs for storage or driver errors.
Essential tools to measure I/O latency
Use a small toolbox of utilities that give complementary views. iostat provides per-device throughput and await numbers, atop or sar help with historical context, and iotop identifies processes generating I/O.
Install and combine these tools to form a baseline, then tighten sampling rates for problem windows.
- iostat -x shows r/s, w/s, await, svctm and %util per device.
- atop captures historical load including disk and process stats.
- iotop or pidstat -d attributes I/O to processes.
Blktrace and perf deep diagnostics
When device-level metrics show high await but the root cause is not obvious, blktrace gives block layer event traces, and perf can show syscall latency and latency histograms. These give high fidelity traces for root cause analysis.
Capture a short blktrace during a problem window, then parse with blkparse to see queue times, merges, and dispatch patterns. Use perf record -e block:block_rq_issue for kernel event correlation when needed.
Reproduce and validate with fio
Reproducing the problematic workload with fio helps validate fixes under controlled conditions. Design fio jobs that match your application’s I/O pattern: read vs write ratio, block size, depth, and random vs sequential access.
Start with a small test file and iterate: increase iodepth and threads to profile queue depth sensitivity, and compare latency percentiles before and after changes.
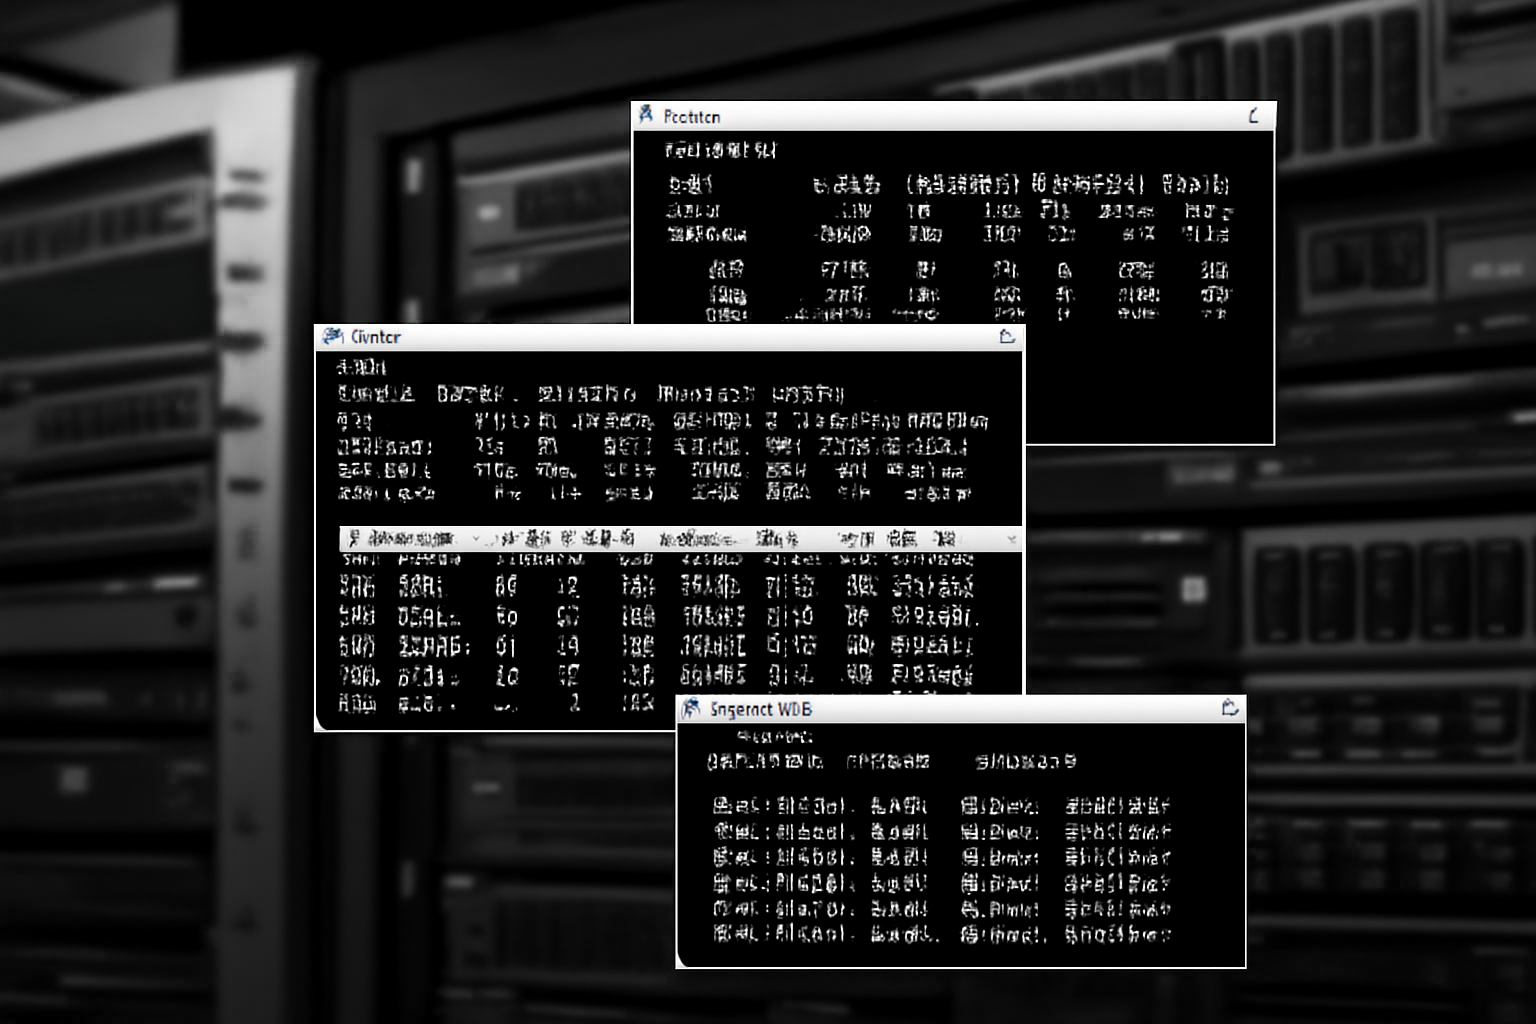
Common root causes and targeted fixes
Typical causes of high iowait include saturated device throughput, high queue depth on slow storage, synchronous workloads, filesystem sync settings, and misbehaving processes that do frequent small writes. Cloud block storage and virtualized environments add extra layers to inspect.
Targeted fixes depend on cause. For device saturation consider faster disks or striping, for excessive small IOPS reduce fsync frequency or batch writes in the application, and for virtualization check host-level contention and queue depth settings.
- Device saturation: add capacity, use NVMe, or change RAID level.
- Small random IOPS: enable writeback cache, tune application flushes.
- Driver or firmware bugs: update kernel, driver, and storage firmware.
Kernel and storage stack tunables to consider
Linux exposes tunables that can significantly change behavior: I/O scheduler, elevator settings, queue depth, and elevator features. On modern kernels with NVMe, prefer mq-deadline or none depending on workload.
Adjust sysfs settings carefully, document changes, and test under load. Common places to tune are /sys/block/
- /sys/block/
/queue/nr_requests adjusts device queue depth. - Change scheduler with echo mq-deadline > /sys/block/
/queue/scheduler for multi-queue devices. - Mount options: noatime reduces metadata writes, barrier settings affect durability guarantees.
Practical remediation steps and example commands
Apply a repeatable sequence: observe, isolate, apply a small change, and validate. Keep changes minimal and reversible so you can roll back if performance worsens.
Examples: reduce iodepth in the application, set noatime on mounts, bump nr_requests for high-latency devices, or move hot files to faster storage. Always test with fio after each change.
- Capture baseline: iostat -x 1 30 > baseline.txt
- Trace block events: blktrace -d /dev/sdb -w 30 -o – | blkparse -i –
- Validate with fio: fio –name=test –rw=randread –bs=4k –iodepth=32 –numjobs=4 –size=1G
FAQs
Below are concise answers to frequent questions encountered when diagnosing high I/O wait on Linux systems. These help with quick decisions during an incident.
Use them as shortcuts, but always verify against measured data on your system.
- Q: Is high iowait always caused by disks?
A: No, it can be caused by slow network storage, controller congestion, firmware issues, or excessive synchronous writes from applications. Correlate device metrics with host and network metrics. - Q: Should I change the I/O scheduler on production systems?
A: Only after testing. Modern kernels and NVMe often perform best with mq-deadline or none, but workload characteristics matter. Test in staging under realistic load. - Q: Can tmpfs or RAM caching help reduce iowait?
A: Yes for temporary and cacheable workloads, moving hot writes to tmpfs reduces disk I/O, but beware of memory pressure and persistence requirements. - Q: How long should I collect traces like blktrace?
A: Capture only the problem window plus a buffer, typically 30 to 120 seconds to minimize overhead and keep traces manageable.
Conclusion
Troubleshooting high I/O wait on Linux requires a methodical approach: confirm the symptom, gather complementary metrics, trace the block layer when needed, reproduce the workload with fio, and apply minimal, reversible remediations. The suite of tools described here, including iostat, atop, blktrace, perf and fio, provide overlapping visibility that uncovers whether the bottleneck lives in hardware, kernel, or application layers.
Start with noninvasive observations, then escalate to targeted tracing only when necessary. Tune kernel and storage stack parameters carefully and document every change. Validate each fix with repeatable tests and monitor percentiles not just averages, because tail latency often drives user experience. With this process you can reduce iowait, improve throughput and stabilize latency for critical services on Linux servers.
Keep an operational playbook with your common commands, fio job files and a rollback plan to reduce mean time to remediate during incidents. Regularly run synthetic tests and review historical atop or sar data so regressions are detected early, and include firmware and driver maintenance in your routine to avoid avoidable storage-layer failures.