Introduction: why Windows memory leak troubleshooting matters
Windows memory leak troubleshooting is a practical skill for system administrators, developers, and security practitioners who manage servers and workstations. A memory leak is when used memory is not released properly, causing system slowdown, paging, and eventually application or system instability. Identifying the source quickly reduces downtime and prevents data loss.
This guide shows a step-by-step approach to confirm a leak, triage with live tools, and isolate driver or nonpaged pool leaks using RAMMap and PoolMon. It also covers Process Explorer, Task Manager, and kernel dump analysis so you can move from detection to remediation with confidence.
Quick triage: confirm there is a leak
Start with a quick triage to confirm a memory leak rather than normal high usage. On affected machines check overall memory metrics, commit size, page file usage, and nonpaged pool trends. Track the problem across minutes and hours to spot continuous growth.
Use these quick checks to validate a leak before deep diving:
- Task Manager: Performance tab, Memory graph and Commit Charge.
- Resource Monitor: use Memory tab to watch Standby, Modified, and In Use bytes.
- Performance Monitor: add counters like Memory\Committed Bytes and Pool Nonpaged Bytes for long term trends.
Task Manager and Resource Monitor first pass
Task Manager gives a fast view of processes using physical memory and commit. Sort by Memory and watch if a single process grows without bound. Resource Monitor breaks down usage into Private, Shareable, Standby, and Modified lists so you can identify whether kernel allocations are involved.
If no user process shows steady growth, but overall memory continues to shrink and nonpaged pool grows, you likely have a kernel or driver related leak. At that point move to Process Explorer and kernel tools for deeper inspection.
Process Explorer: per-process details and handles
Process Explorer from Sysinternals reveals private bytes, virtual size, and detailed memory maps for processes. Use View, Lower Pane View to inspect DLLs and allocation stacks when available. Right click a suspect process and check Properties, Performance, and Threads for suspicious activity.
Process Explorer also exposes handle counts and GDI objects. A process leaking handles often contributes to memory pressure indirectly, so correlate handle growth with overall memory changes while monitoring the system.
RAMMap: analyze physical memory allocations
RAMMap shows how Windows uses physical memory across categories: Active, Standby, Modified, Mapped Files, and more. Use the Use Counts and File Summary tabs to see whether file mappings or drivers hold large amounts of physical RAM. Sort by Active or Mapped File to find culprits quickly.
RAMMap can export snapshots for comparison. Capture snapshots over time to see which categories are increasing. When nonpaged or paged pool growth appears in RAMMap, note the tags and file mappings for further investigation with PoolMon or driver analysis.
PoolMon: find kernel pool tag leaks
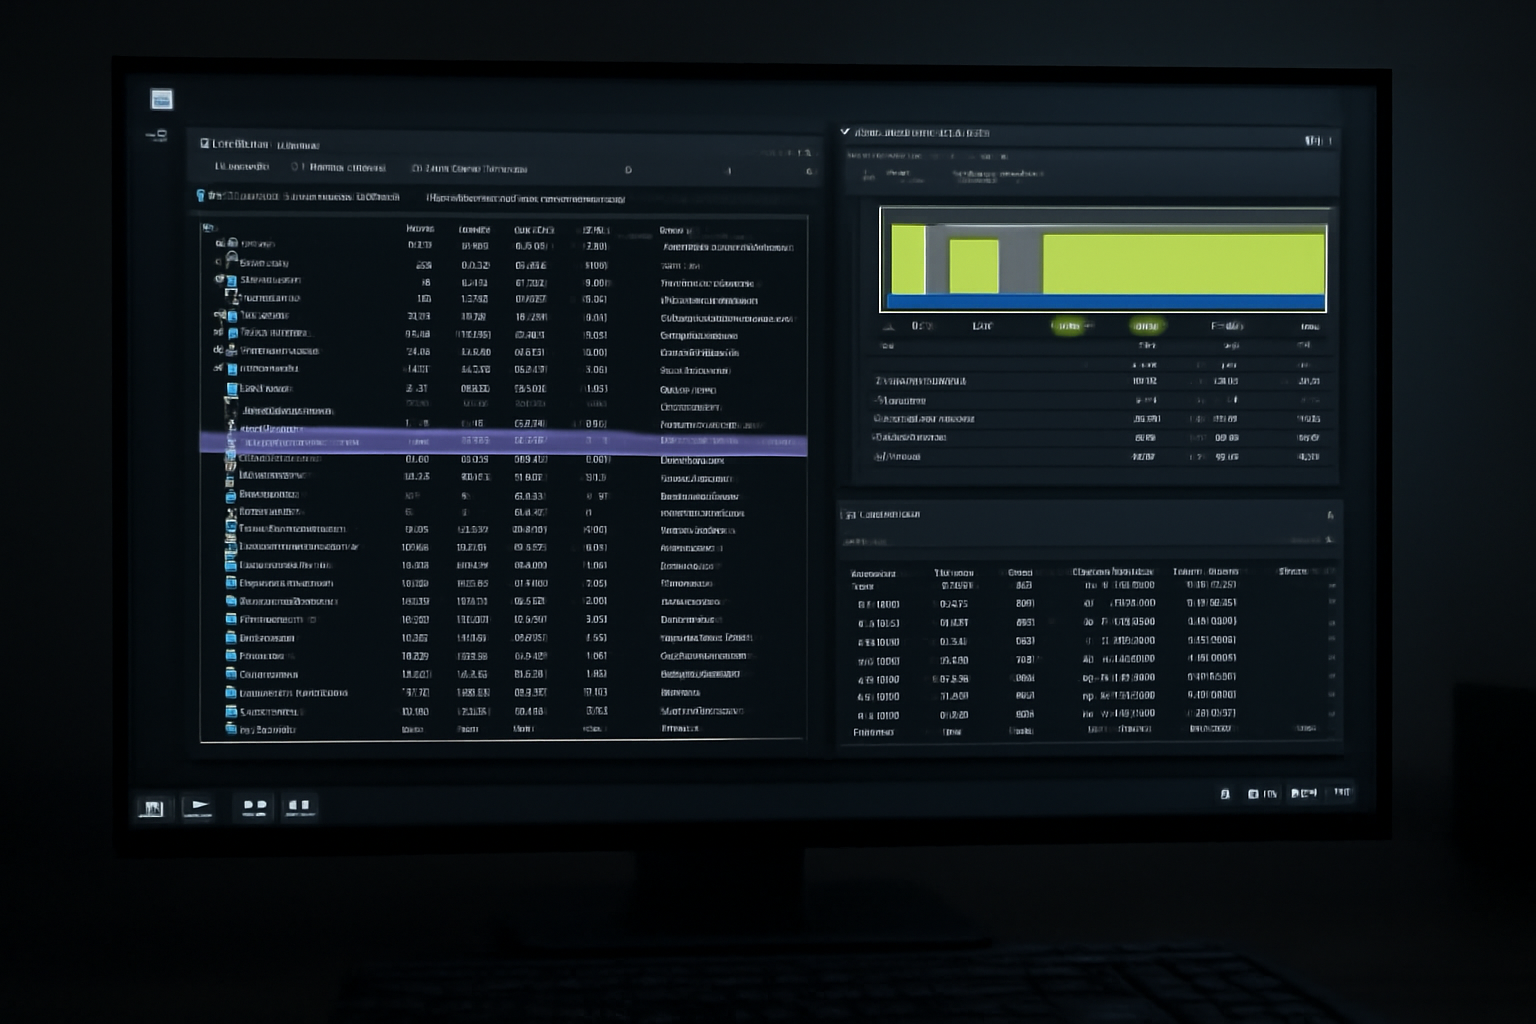
PoolMon is the standard tool to inspect kernel pool usage by tag. Run PoolMon from an elevated command prompt after enabling it in the Windows Driver Kit tools, then sort by Alloc or Bytes to surface tags that grow continuously. Note the tag names and their associated bytes and allocations.
Common PoolMon workflow:
- Boot elevated command prompt, run poolmon -b for brief output.
- Sort by Bytes using the hotkeys, watch tags that climb over time.
- Map tags to drivers by searching online or using debugging symbols and windbg if required.
Kernel dumps and WinDbg for stubborn leaks
If live tools do not identify the owner of a leak, capture a kernel memory dump and analyze it in WinDbg. Use the pool verifier and !poolused command to inspect pool allocations and !poolfind to locate allocations for a specific tag. WinDbg lets you link allocations to drivers and call stacks if pool tagging and symbols are present.
Collect multiple dumps over time to compare backtraces and see which allocations persist. Enable Driver Verifier selectively for suspected drivers to get more informative dumps, but do this on test systems or maintenance windows to avoid crashes on production boxes.
Mitigation strategies and temporary fixes
Once you identify a leaking driver or process, apply practical mitigations to restore system stability. These can be temporary until a patched driver or application release is available. Common actions include disabling the problematic driver, rolling back to a known good driver version, or applying vendor hotfixes.
Mitigation checklist:
- Restart the offending service or process to free leaked user memory.
- Unload or roll back drivers that own leaking pool tags, after confirming dependencies.
- Apply OS updates, vendor drivers, or firmware that address known leaks.
- Use memory limits or job objects to contain misbehaving processes until a permanent fix is available.
FAQs: common questions when troubleshooting memory leaks
Below are common questions and concise answers to speed triage. These reflect scenarios typical in enterprise Windows environments, from workstations to servers running heavy workloads.
Refer to the tools and steps above when applying any suggestion, and always test changes in a controlled environment if possible.
Q: How do I tell user space leaks from kernel leaks?
A: User space leaks show as steady growth in a process private bytes, visible in Task Manager or Process Explorer. Kernel leaks manifest as growing pool usage, seen in RAMMap under Pool sections or Pool Nonpaged Bytes in Performance Monitor, and confirmed with PoolMon.
Q: Can antivirus cause memory leaks?
A: Yes, security products can allocate kernel resources or large mapped files. If PoolMon or RAMMap implicates a tag associated with AV drivers, consult vendor guidance, update signatures, or test disabling the agent temporarily to confirm impact.
Q: Should I run Driver Verifier on production?
A: Driver Verifier is powerful but can cause system crashes to expose bugs. Use it on test systems or during maintenance windows. When used properly, it can generate crash dumps that pinpoint driver code paths responsible for leaks.
Q: How long should I monitor to confirm a slow leak?
A: Monitor over hours or days depending on the leak rate. Low rate leaks may need longer capture windows and periodic RAMMap or PoolMon snapshots. Use Performance Monitor to log counters over time for reliable trend analysis.
Conclusion
Troubleshooting Windows memory leaks requires a methodical approach, starting with quick triage using Task Manager and Resource Monitor, moving to Process Explorer for per process diagnostics, and then using RAMMap and PoolMon for kernel allocations. When live inspection is insufficient, kernel dumps analyzed in WinDbg and targeted Driver Verifier runs help identify offending drivers or kernel components. Combining these tools with careful change control reduces downtime and avoids unnecessary reboots.
Practical mitigation often involves temporary containment while coordinating with vendors for patches. Keep a library of known pool tags and driver mappings, automate periodic snapshots with RAMMap or Performance Monitor for recurring issues, and document remediation steps so your team can respond faster next time. With structured triage and the tools outlined here, you can identify, isolate, and resolve Windows memory leaks efficiently, restoring system stability without guesswork.